Despite their similarities in displaying and comparing statistical data, a bar chart and a histogram are two different types of graphical presentations. This article shows the differences between the two.
Summary Table
| Bar Chart | Histogram |
| Presents categorical data | Presents quantitative data |
| Displays distinct elements | Displays elements that are grouped together and are considered ranges |
| Plots data into separate rectangular bars | Plots data into bins, which group values into specific intervals |
| Columns can be rearranged | Columns cannot be rearranged |
| Columns are separated by gaps or spaces | Columns are not separated by gaps or spaces |
| Individual bars represent categorical data | Individual bars represent a single value or a range of values |
| Width of bars is always identical | Width of bars may not be identical |
Definitions
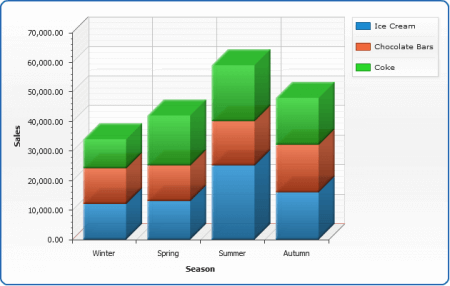
A bar chart, also known as a bar graph, is a presentation that breaks down categorical data by groups, which are represented by rectangular bars of different lengths. Most useful in displaying differences in value amongst a set of variables, a bar graph compares data by the use of either vertical or horizontal bars.
A bar chart is made up of a horizontal and a vertical axis. While one axis displays specific categories, the other presents discrete values. The length of the bar is proportionate to the value it represents. Aside from organizing and comparing data, a bar chart is also used to show patterns and changes that occur over time.
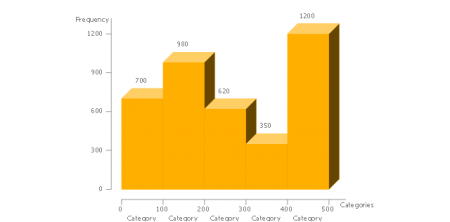
A histogram is a graphical presentation that accurately shows the distribution of statistical data. It plots and groups quantitative data into intervals, also known as bins.
Popular for displaying frequency distribution and class interval, a histogram displays values by the use of rectangular bars. To construct a histogram, values are first categorized into bins, which group values into specific intervals. The height of the rectangular bars is proportionate to the frequency, or the specific number of cases in the bins.
Bar Chart vs Histogram
So what’s the difference between a bar chart and a histogram?
Firstly, a bar chart displays and compares categorical data, while a histogram accurately shows the distribution of quantitative data. Unlike bar charts that present distinct variables, the elements in a histogram are grouped together and are considered ranges.
Since they vary in purpose, they plot data in different ways. While a bar chart breaks down categorical data into rectangular bars or columns, a histogram plots data in bins, which group values into specific intervals. The rectangular bars in a bar chart can be rearranged, while the bins in a histogram follow a fixed order.
Another notable difference between a bar chart and a histogram is the presence and the absence of gaps between the bars. The bins are not separated by gaps since the intervals are presented consecutively. The columns in a bar chart, on the other hand, are typically displayed with gaps in between.
Additionally, the rectangular columns in a bar chart represent a categorical variable, and the length of the bar is proportionate to the value or the size of the group it represents. Meanwhile, the bars in a histogram portray a quantitative variable, which can either depict a single value or a range of values. The height of the columns in a histogram is proportionate to the size of the group or interval it represents.
Lastly, the width of the bars in a bar graph is the same, while the width of the bars in a histogram may not be equal in size since its width is dependent on the range of the area it represents.

